Why the Busiest-Looking Scans in Your Training Set Might Be Hurting Your OCR Model
Based on: ERank in Latent Space as an Image-Complexity and Richness Measure — Maksim Smirnov, Grigory Kononov, Anastasiia Linich, Egor Surkov, Egor Shvetsov
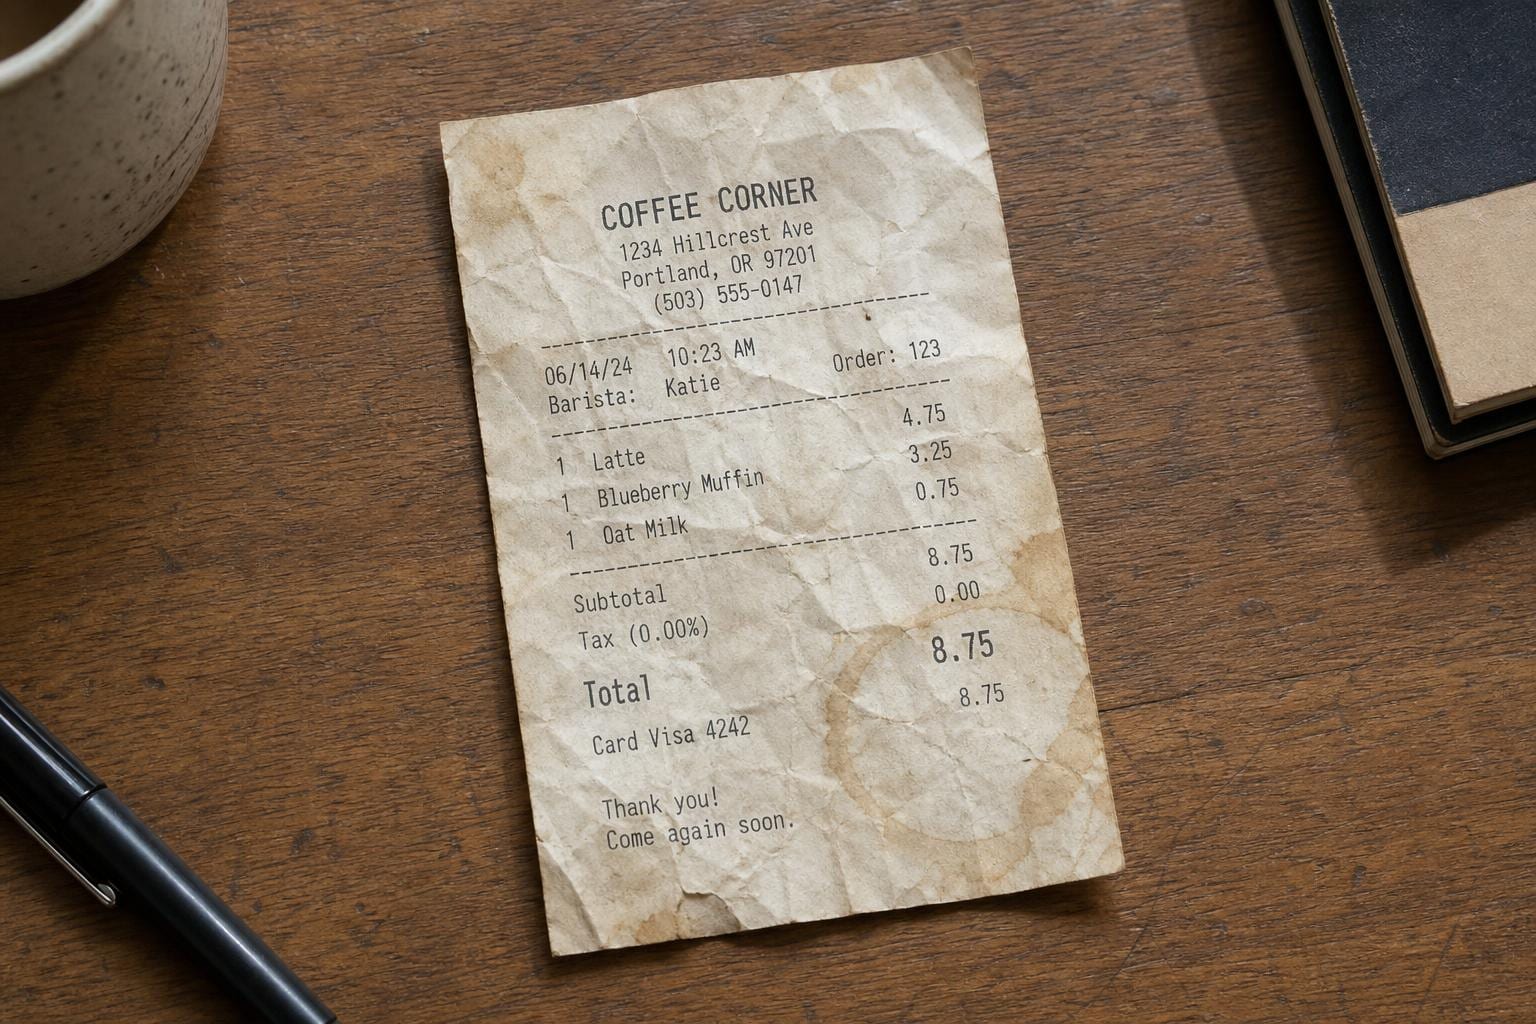
Picture two document scans sitting in the same training folder. One is a clean invoice: white background, black text, a logo in the corner. The other is a receipt that's been through a wallet for a week, stained, wrinkled, printed on shiny thermal paper that catches the light. Your eye can tell they're different. What a new paper argues is that you can also get a number for that difference, computed from a single pass through a neural network, with no labels and no training involved. And here's the part that should make anyone curating OCR data sit up: for OCR specifically, the documents that score highest on this number are often the ones you should throw away.
The paper is called "ERank in Latent Space as an Image-Complexity and Richness Measure," from Maksim Smirnov, Grigory Kononov, Anastasiia Linich, Egor Surkov, and Egor Shvetsov. It's a short, useful idea dressed up in some linear algebra, and it's worth understanding both because the metric itself is cheap and reusable, and because the data-selection result cuts against the instinct that "more information is always better training data."
Measuring "how much is going on" in an image is harder than it sounds
Say you want to rank a pile of images by visual complexity, from plain to busy. You'd think this is solved. It isn't, not cleanly.
The cheap options are all proxies for something else. JPEG file size (or codec bitrate) tells you how compressible an image is, which correlates with complexity but also with resolution, noise, and the whims of a specific codec. Edge density, how many pixels a Sobel or Canny filter flags as an edge, picks up texture but treats a photo of gravel and a photo of dense text as similarly "complex," which is not useful if you actually care about content. Sharpness metrics (usually the variance of a Laplacian filter) tell you about focus, not richness. None of them require a trained model, which is their appeal, and none of them agree with each other or with how a person would rank the same images.
The expensive option is to just ask people. IC9600 is a public dataset built exactly for this: 9,600 images with human-annotated complexity scores. It's a good ground truth, but you can't run a human panel over every image in a multi-million-sample training set, and you shouldn't need to.
What's missing is something in between: cheap like the pixel-level heuristics, but informed by what a trained model actually "sees" in the image the way the human raters implicitly do. That's the gap ERank tries to fill.
Counting how many directions an image actually uses
Here's the mechanism, stripped of the math. Run an image through a frozen, already-trained image encoder, the kind used for classification or embeddings, and stop partway through, at one of the internal feature maps. That feature map has a channel for every learned pattern the network detects: edges at certain angles, color contrasts, texture types, whatever the network picked up during its own training. At every spatial location in the image, each of these channels fires with some activation value.
Now ask a simple question: across the whole image, how independent are these channels from each other? If a blank wall is going through the network, most channels are going to move together, because there's nothing local to differentiate them, largely flat color, no edges, no texture. A handful of channels explain almost all the variation. If a farmer's market or a cluttered desk is going through the network, different regions activate wildly different combinations of channels, edges in one patch, color gradients in another, fine texture somewhere else, so many more channels are behaving independently of one another.
You can formalize "how many channels are behaving independently" with the effective rank of the channel covariance matrix. Take the covariance between channels across the image, get its eigenvalues, normalize them into a probability distribution, and compute the entropy of that distribution. Exponentiate the entropy and you get a number, ERank, that behaves like a rank but doesn't need to be a whole number. A boring image might score an ERank of a dozen or so out of hundreds of possible channels. A rich, cluttered one might use many times that. It's a soft count of how many independent "knobs" the image is actually turning, not a labeled judgment, not a file size, just a property of how the image sits in the network's own learned feature space.
This is the clever part of the paper: it needs no training, no labels, and no task-specific setup. Run the encoder once, do a bit of linear algebra on the output, done.
Does the number actually track what humans call complex?
Reasonably well. Against the human ratings in IC9600, ERank correlates at r = 0.72. That's not a perfect match, roughly half the variance in human ratings is unaccounted for, but it's a solid result for a fully automatic, label-free measure being checked against subjective human judgment, which is a genuinely noisy target itself (people don't agree with each other perfectly on "complexity" either).
ERank also tracks the cheap heuristics it's meant to improve on: codec bitrate, sharpness, and edge density all move with it. That's reassuring rather than surprising. It confirms ERank isn't measuring something totally orthogonal to the intuitive notion of visual busyness. It's a better-grounded version of the same idea, built from a model's learned representation instead of raw pixel statistics.

The catch: noise looks complex too
Here's where the paper does something I like: it doesn't just report a correlation and move on. It examines how ERank behaves under noise, and the honest answer is that noise inflates it. If you add random pixel noise to an image, you decorrelate the channels almost by construction, static doesn't respect edges or textures, so a noisy image can rack up a high ERank without carrying any more real content than it started with.
This matters a lot for anything document-shaped. Scan artifacts, paper grain, JPEG compression blocks, and watermark bleed-through are all noise in this sense. A scanned page with visible paper texture and a faint background watermark can score as "richer" than a crisp digital PDF export of the identical text, even though nothing about the actual content changed. ERank doesn't cleanly separate "this image has genuinely more visual information" from "this image is just noisier." That ambiguity turns out to be central to why the metric works so well as an OCR data filter, and it's also the thing to keep in mind before trusting the number blindly.
The real finding: pruning by ERank helps some tasks and actively doesn't help others
This is the part with teeth. The authors used ERank as a data-selection criterion, meaning they trained models on subsets of a dataset chosen by cutting off the top or bottom of the ERank distribution, and measured what happened across several vision tasks.
Two results stand out because they point in opposite directions:
-
Super-resolution got better when the low-ERank images were removed. Super-resolution models learn to reconstruct fine detail from a blurry or downsampled input. An image that's mostly flat, a wall, a sky, an empty tabletop, gives the model almost nothing to learn from about reconstructing texture. Training on a pile of those wastes capacity on near-trivial examples. Cut the bottom of the ERank distribution and what's left is richer, more textured, more instructive for a model whose whole job is hallucinating detail.
-
OCR got better when the high-ERank images were removed. This is the counterintuitive one. You'd think more visual information in a training document would help a model that reads that document. But for OCR, the useful signal, the glyphs, lives in a comparatively low-complexity part of the image: mostly flat background, sharp dark strokes. The images racking up the highest ERank scores in a document corpus tend to be the ones where something other than text is dominating the feature space: heavy background patterns, embedded photographs, marbled paper, dense watermarking, or just scan noise, exactly the noise-versus-signal ambiguity the paper flags earlier. Training on those spends effort on backgrounds instead of glyphs, and the top slice of the ERank distribution is disproportionately where that clutter lives.
And the finding that ties it together: pruning by ERank did nothing for classification, segmentation, or denoising. The abstract's framing for why is the clean summary: ERank helps exactly when task difficulty is governed by how rich or plain the input is. Whether a model can name the object in a photo, or draw an accurate mask around it, doesn't hinge on how many feature channels the whole image lights up. A dog on a busy patterned rug isn't harder to classify than a dog on plain grass just because the rug scores a higher ERank. Complexity-as-richness and task-as-hard are two different axes, and for those three tasks they don't line up.
This held in both pretraining and finetuning, which suggests it isn't some artifact of one training regime, it's a property of what the tasks actually need from their data.
Why it matters for anyone building or choosing OCR
If you're curating or auditing a training corpus for a document model, ERank gives you a free, automatic way to flag the subset of your data that's more likely to be background clutter than useful text signal, without hand-labeling a single image or waiting on a human complexity panel. That's a real, usable filter, not a research curiosity: run the encoder pass once over your corpus, sort by ERank, and take a hard look at the top slice before you train on it.
It also offers a plausible explanation for a pattern that's easy to notice but hard to name precisely: some document types are chronically harder for OCR engines, marbled book endpapers, forms with heavy watermarking, receipts with printed background logos, and it's tempting to just call these "hard documents" without a way to quantify why. ERank gives you a number for "why": these are the pages where the background is competing with the text for the model's attention, and that competition is measurable before you ever run OCR on them.
There's a further application worth watching rather than adopting outright: a platform that routes documents across multiple OCR engines could, in principle, use ERank as a per-document signal, sending high-ERank pages (more likely to be visually cluttered or noisy) to a more robust or expensive engine, and clean low-ERank pages to a cheaper, faster one. Nobody has built or validated that pipeline yet based on this paper. It's a natural extension of the result, not a claim the paper makes.
What's still unproven
The correlation with human judgment, r = 0.72, is good but not tight. A meaningful share of what humans call "complex" isn't captured by counting active feature directions, and it's worth remembering that before treating ERank as ground truth rather than a useful proxy.
The metric also depends on which frozen encoder you run it through. A network pretrained on natural photos learns a different set of channels than one pretrained on documents or trained with a different objective entirely, and the paper's own results will be tied to whatever encoder they used. Anyone reusing ERank on a different domain should expect to re-validate it rather than assume the same thresholds transfer.
The noise sensitivity is the one I'd watch closest for OCR specifically, given how much production document data (real scans, phone photos of receipts, faxes) carries acquisition noise that has nothing to do with content richness. If ERank can't fully tell "genuinely richer image" apart from "noisier image," some fraction of what gets pruned as high-ERank "clutter" could just be scan grain, and some fraction of genuinely complex, information-dense documents could get thrown out alongside it. The paper's OCR result held up in aggregate, which is the evidence that matters, but it doesn't mean every individual document tossed by the filter deserved to go.
And the data-selection results come from research benchmarks with clean before/after comparisons. Production pipelines are messier: mixed document types, mixed acquisition quality, mixed downstream uses for the same corpus. Whether "cut the top N% by ERank" is the right rule for a specific dataset probably needs its own check, not a blind copy of whatever percentile worked in the paper. Treat ERank as a strong, cheap first-pass filter worth testing on your own data, not a settled recipe.