Inside the 22.6-Million-Image Pipeline Harvard Built to Find the Pictures OCR Ignores
Based on: Institutional Books - Visual Elements: An open-source pipeline for extracting, classifying, deduplicating, and captioning visual elements from digital book collections — Jimmy Mendez, Matteo Cargnelutti, David Lowry-Duda, Catherine Brobston, Salwa Ismail, Greg Leppert, Amanda Watson, Jonathan Zittrain
Somewhere in Harvard Library's digitized collection sits a single volume, an art-reference catalogue of Greek and Roman statuary, that produced 5,260 separate image detections on its own, more distinct visual elements than most small museums catalogue in a decade, pulled out of one book. The team behind this project noticed it skewing their averages so badly they gave it a nickname: "Spiders Georg," after the old internet joke about one guy with 100,000 spiders wrecking the average spider count in his village. It's a fun detail, and also a preview of the real subject here: what it takes to find every illustration, engraving, photograph, and decorative flourish hiding inside 983,004 scanned books, at a cost that doesn't bankrupt a library.
That's the project a team at Harvard Law School Library's Institutional Data Initiative just published: Institutional Books - Visual Elements, a companion to their earlier text-and-metadata release of the same collection. The new work runs an open-source pipeline over roughly 400 million page scans from Harvard's Google Books partnership and pulls out 22.6 million visual elements, each detected, classified, deduplicated, and, for a large subset, captioned. The dataset and pipeline are public on Hugging Face and GitHub, worth a look for anyone working near document AI, OCR, or digital archives.
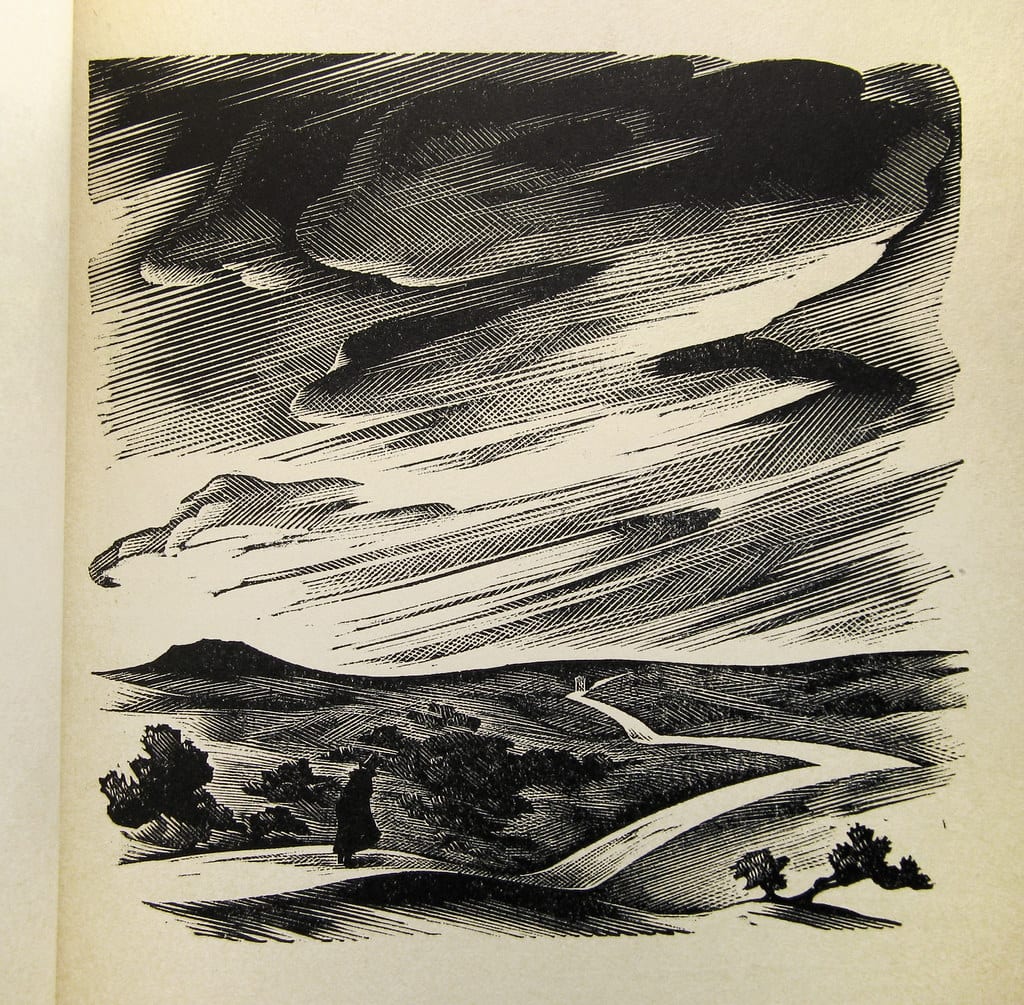
Agnes Miller Parker - Wood Engraving for 'The Return of The Native' — by Thomas Shahan 3 via flickr, BY 2.0.
The problem OCR quietly ignores
Optical character recognition has gotten very good at one specific job: turning pixels of text into machine-readable text. Every large-scale book digitization effort leans on it. But a scanned page isn't just text. Older books are full of woodcuts, engravings, lithographs, hand-tinted plates, sheet music, diagrams, and the occasional stray thumb caught mid-scan. None of that gets touched by a text pipeline. It just sits there in the page image, unindexed and unsearchable.
That gap matters more now than it used to. Vision-language models, the AI systems that can look at an image and describe or reason about it, are trained mostly on the internet's contemporary visual diet: memes, product photos, screenshots, modern art. The paper cites recent work showing these models struggle with historical imagery, degrade under what researchers call "temporal distribution shift" (the mismatch from feeding a model a 19th-century woodcut when it learned mostly from modern photos), and are prone to anachronistic reasoning, like describing a steam engine as though it were a modern train. If nobody surfaces historical visual material in a form models can learn from, that blind spot doesn't close on its own.
The scale involved isn't small either: about 400 million page scans totaling 60 terabytes, most containing zero illustrations, a handful, like the statuary catalogue, containing thousands. Sifting all of that without missing real visual elements or drowning in false positives from an oddly formatted paragraph is a hard systems problem before it's even an AI problem.
Small model, big collection
Here's the most quietly opinionated choice in the whole report. Vision-language models can, in principle, both find and describe visual elements in one pass, so why not just point one at 400 million pages and let it work? The authors' answer: cost, and a mismatch between what VLMs are good at and what this task needs. Running a transformer-based VLM against a collection this size would be, in their words, out of reach for most libraries. And the main advantages of a VLM, few-shot learning, robustness to weird inputs, don't buy much when your data has strong, consistent visual and typographic conventions, which digitized book pages do. So instead they trained a small, purpose-built detector: a YOLO26n model with 2.4 million parameters, a fraction of the size of even a modest language model.
They started with 109 manually annotated pages, scaled the training set to 4,528 pages across 271 volumes, and deliberately included pages with no visual elements at all, since most pages in the collection are pure text and the model needed to learn to say "nothing here" with confidence. Training the final model took 1.4 hours on four GPUs. On a held-out test set of 453 pages, it hit 0.95 precision and 0.96 recall on the binary task of "is there a visual element here or not." Strong performance from a genuinely tiny model, and the clearest evidence for the "frugal computing" philosophy the authors state up front: start with the smallest viable intervention, and only spend more compute when the small thing demonstrably fails.
The bottleneck in production wasn't even the model. It was disk I/O. Across the 16-day detection run over 394 million page scans, 89.5% of processing time per page went to loading and decoding image files from disk, versus under 10% for the neural network inference itself, leaving four dedicated GPUs idling at under half their theoretical throughput. A useful reminder that in large document pipelines, the model is often not where your time goes.
A telling side note: heatmaps of the detector's attention showed it leans heavily on the whitespace around a page's margins to decide whether something unusual is present, since text blocks are visually uniform and illustrations break the pattern.
Five buckets, and where the model gets confused
Once a region is flagged, a second small model sorts it into one of five categories: Image/Illustration, Music, Artifact, Ex Libris/Decorative, and Chart/Graph. "Artifact" is the catch-all for scanning noise: hands caught mid-scan, metal page clips, torn corners. Per-class accuracy is strong across the board, 0.98 precision on Image/Illustration, 0.99 on Music, except one soft spot: Chart/Graph sits at 0.87, and 12.9% of Ex Libris/Decorative predictions came back low-confidence and got reclassified.
The paper is candid about why: bookplates, printer's marks, and decorative borders often look, structurally, a lot like small illustrations, and the model has to guess from limited context which bucket a given ornamental flourish belongs to. One example: three ornate ex libris bookplates from a library competition get correctly detected but land in "Image/Illustration" instead, since in isolation a bookplate and a small illustration look alike.
Music got its own fix. The classifier kept mistaking anything with dense small marks or staff-like lines for the Music category, so the team layered in a second signal: trust confidence above 0.99 outright, and below that, only keep the Music label if the crop's AI-generated caption contained an actual music-related keyword. That rule reclassified 12,502 of roughly 1.2 million Music predictions down to "Other." A small operational detail, but a real one: sometimes the fix for a stubborn classification error isn't a better model, it's a second, cheaper signal that catches what the first one missed.
Finding the same barcode 418,436 times
Digitizing a million books produces a lot of duplicates: the same illustration reused across print runs, decorative borders a publisher stamped on every chapter heading, and, less glamorously, the physical barcode stickers Harvard's own Widener Library put on scanning cradles, which the detector dutifully flagged as visual elements every time they appeared in frame.
The pipeline handles this in two stages: cheap perceptual hashing for near-identical images, the kind of pixel-for-pixel duplicate from a page scanned twice by accident, then dense embeddings, via SSCD, a model purpose-built for copy detection, for content that's visually similar but not identical, say the same illustration reprinted at a different resolution. The authors tested SSCD against four general-purpose multimodal embedding models, including CLIP and SigLIP 2, and SSCD won clearly: 0.93 precision and 0.82 recall on their benchmark, well ahead of the closest general-purpose alternative. Worth noticing: a narrow model beating a bigger, more hyped one.
Applied alone, hashing collapsed the raw 43.7 million detected crops by 22%; embedding similarity was more aggressive, cutting it by 31%. The team chose the conservative option for the final release: only merge two crops into a duplicate group if both methods agree, which brought the total down by 19.6%, landing at 22,622,060 unique visual elements. The two largest duplicate clusters found were 824,599 near-identical copies of the same decorative border ornament, and 418,436 instances of that Widener Library barcode sticker. Somewhere in a scanning room, someone put a barcode on hundreds of thousands of cradles, and a pipeline built to find historical illustrations dutifully noticed every one.
The experimental part: letting an LLM write the captions
The most interesting, and most hedged, piece of the pipeline is captioning. For 18.5 million of the 22.6 million elements, skipping Ex Libris/Decorative and Artifact crops since a bookplate or scanning clip doesn't need a description, the team used OpenAI's GPT-4.1-nano, fed both the cropped image and the surrounding page's OCR text as context, and asked for a caption of 50 words or fewer, in the book's original language.
The scale is worth sitting with: 34.263 million API requests, 66.994 billion input tokens, at a total cost of $4,441.42 thanks to prompt caching. A remarkably cheap way to generate nearly 767 million tokens of descriptive metadata, and exactly the kind of number that should make anyone pause before trusting the output at face value.
To their credit, the authors don't oversell it. They call this component explicitly "experimental," distinct from the detection, classification, and deduplication stages, which are well-established techniques they could measure cleanly against ground truth. Captioning historical imagery with an LLM is an open research problem: general-purpose VLMs likely lack specialized knowledge of period-specific printing techniques, and hallucination, describing something plausible-sounding but wrong, is a real risk they couldn't rule out. Early testing found the model sometimes summarized the surrounding page text instead of describing the image itself, which they mostly filtered out downstream, but not with full confidence.
They also tried running content-safety models over the generated captions to catch anything harmful, and it didn't go well enough to trust: what counts as offensive or inaccurate framing shifts with a document's era and context in ways a generic filter doesn't capture. So the captions ship "as is," an experimental layer on a solid foundation, not verified ground truth.
Why it matters for anyone building or choosing OCR
If you're evaluating OCR or document-AI tools for a real project, three things here are useful independent of whether you ever touch a historical book collection.
Text extraction and visual extraction are separate problems, with separate error modes. If your pipeline only does OCR, you're implicitly deciding that everything in a document that isn't text doesn't exist. That's fine for contracts and filings, where diagrams are supporting cast. It's a real gap for a scanned archive: a form with a signature, a lab notebook with a hand-drawn figure, an old record with a photograph attached. Worth asking any OCR vendor directly what happens to the parts of the page that aren't text.
A small, task-specific model beat the "just throw a VLM at it" instinct, decisively, on cost and accuracy. This pattern shows up again and again in production document AI. If your documents have consistent structure, a receipt template, a form layout, a document type users upload repeatedly, a small fine-tuned model will often outperform a general-purpose model at a fraction of the inference cost. Save the expensive model for the ambiguous cases, exactly the hybrid approach the authors flag as a promising direction: cheap detector for the easy 95%, VLM only for the borderline calls.
Any pipeline stage that adds LLM-generated metadata needs its own confidence signal, not the trust level of the deterministic stages before it. The authors tracked token-level log probabilities for every caption and labeled the entire captioning output as experimental in the dataset schema, distinct from fields sourced directly from the original library metadata. Good practice for anyone shipping AI-generated document metadata: don't let a hallucination-prone stage quietly inherit the credibility of the stages around it.
What the dataset can't tell you
The paper's most honest section isn't about the models, it's about who ended up represented. Because illustrated printing exploded with 19th-century technology like wood engraving and lithography, the visual dataset skews hard toward the 1800s and 1900s (64% and 33% of heavily-illustrated volumes respectively) and away from older, text-only works. English-language books are overrepresented relative to their share of the underlying text corpus, since English-language volumes here tend to be more image-dense. Fine Arts and the sciences are wildly overrepresented; Law, despite being 13% of the underlying text collection, contributes only 4.2% of volumes with detected visual elements, since legal texts of that era were almost entirely prose.
None of this is a flaw exactly. It's an honest measurement of a real, structural bias in what got illustrated in the first place, filtered further by which languages and layouts the detection model handles well. But it's a warning label for anyone planning to train a model on this data: you'd be training on a visual record that's disproportionately English, recent, and drawn from fields that happened to rely on pictures. The authors also flag mundane caveats: rights determinations, based on HathiTrust's public-domain status, are "occasionally subject to error," and duplicate volumes leave a residual risk of the same image landing in both a training split and a test split downstream.
It's an unusually transparent technical report for exactly this reason. Most released datasets show the impressive numbers and bury the skew in an appendix nobody reads. This one puts it in a dedicated section, with the actual percentages, and says plainly what conclusions not to draw. That kind of honesty about a dataset's own limits is worth remembering long after "Spiders Georg" stops being the most memorable detail in the report.